Florida Foreclosures Rise: Sarasota Market Impact
Florida led the nation in foreclosure activity during the first half of 2026, but the numbers need context. Rising filings signal more homeowner strain and potential future inventory; they do not mean Florida is repeating the 2008 housing crash.
Foreclosure activity is rising nationally
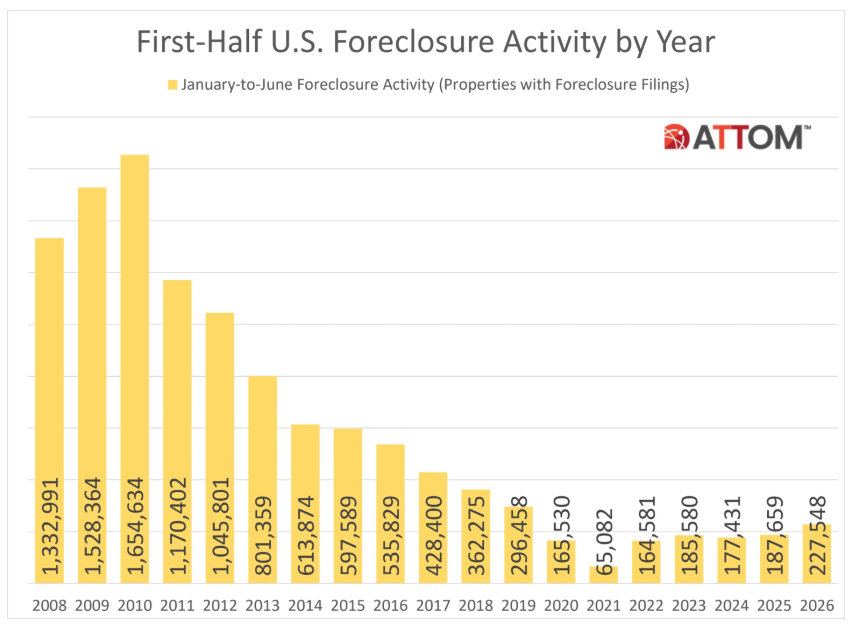
According to ATTOM’s Mid-Year 2026 U.S. Foreclosure Market Report, 227,548 U.S. properties had a foreclosure filing during the first six months of 2026. That was 21% higher than the same period in 2025 and 28% higher than the first half of 2024.
Foreclosure starts reached 164,566 properties, an 18% annual increase. Lenders completed foreclosures on 27,983 properties, up 33% year over year, although completed foreclosures remained 26% below the first half of 2020. The average property completed in the second quarter had spent 563 days in the foreclosure process—the shortest average since 2013.
ATTOM CEO Rob Barber described the broader pattern as a gradual return toward more typical foreclosure activity, while acknowledging that more homeowners may be under financial pressure than they were a year ago.
Why Florida deserves closer attention
Florida recorded 27,494 properties with foreclosure filings and the nation’s highest state foreclosure rate: 0.27% of housing units, or approximately one in every 373 homes. Florida’s filing count was about 33% higher than in the first half of 2025.
Southwest Florida also appeared prominently in ATTOM’s metro rankings. Punta Gorda had the highest first-half foreclosure rate among U.S. metropolitan areas with at least 200,000 residents, at 0.50% of housing units. Cape Coral ranked among the ten highest at 0.35%.
Those statistics matter to buyers and sellers in Sarasota County, North Port, Venice, Wellen Park and Lakewood Ranch because nearby distress can influence buyer expectations, appraisal conversations and future inventory. They are a reason to monitor local conditions—not a reason to assume every Southwest Florida neighborhood is moving in the same direction.
A foreclosure filing is not a completed foreclosure
ATTOM’s filing count combines three stages of the process:
Default notices, when a borrower has fallen behind and the formal process begins;
Scheduled auctions, when a sale date has been set; and
Bank repossessions, or REOs, when the lender has taken ownership.
Nationally, the 27,983 completed foreclosures represented about 12% of the 227,548 properties with filings. A filing may be resolved through reinstatement, modification, repayment, sale, short sale, bankruptcy or another outcome before a bank takes title.
For that reason, a headline about “foreclosure activity” should never be read as a count of families who have already lost their homes. Exact county and metro totals should come from ATTOM’s detailed datasets or verified court records. Sarasota County and Charlotte County Clerks of Court are useful local sources for recorded foreclosure cases.
What is shadow inventory?
Shadow inventory describes homes that may reach the market but are not yet included in the active for-sale inventory. It commonly includes:
homes with borrowers seriously delinquent on their mortgages;
properties already moving through foreclosure; and
bank-owned homes that have not yet been listed.
Some market analysts use a broader definition that also includes owners who would like to sell but are waiting for prices or equity to improve.
Shadow inventory matters because buyers and sellers make decisions using the visible supply of active listings. If a meaningful number of homes is waiting behind that figure, inventory can rise later and create more negotiating room for buyers. The size, condition and timing of that supply are more important than the label itself.
Are we on the cusp of another Great Recession?
The latest report does not establish that conclusion. Foreclosure filings are increasing, yet completed foreclosures remain below 2020 levels. Today’s homeowners also entered this cycle with different loan standards and, in many cases, substantial equity.
The useful question is not whether 2026 will repeat 2008. It is whether local delinquency, insurance costs, property taxes, mortgage rates, employment and active inventory are combining to create more motivated sellers in a particular community.
That is why neighborhood-level analysis matters. Sarasota, North Port, Venice, Wellen Park and Lakewood Ranch can experience very different demand, inventory and price trends at the same time.
What this means for Sarasota-area buyers and sellers
For buyers: Track price reductions, days on market, seller concessions and properties returning to the market. Distressed or highly motivated sales can create opportunities, but title, condition, financing and repair risks require careful due diligence.
For sellers: Price against current competing inventory, not last year’s headlines. Good preparation and a realistic launch strategy become more important when buyers have additional choices.
For homeowners under pressure: Seek qualified legal, housing-counseling and financial guidance early. More options may be available before an auction or completed foreclosure.
The takeaway
Florida’s foreclosure activity is rising, and Southwest Florida contains some of the highest-rate markets in the country. The data deserves attention, but it does not support treating every filing as a bank repossession or every neighborhood as distressed. Local inventory, completed sales and court records will show where the pressure is actually reaching the market.
Want a neighborhood-specific market review? Contact Myra K. Peric for a current look at inventory, pricing and buyer opportunities across Sarasota County and Southwest Florida.
Source: ATTOM, 2026 Mid-Year U.S. Foreclosure Market Report, published July 16, 2026. This article is for general information and is not legal, tax or financial advice.
Social hashtags: #SarasotaRealEstate #FloridaRealEstate #SarasotaHomes #SRQ #NorthPortFL #NorthPortRealEstate #VeniceFL #WellenPark #LakewoodRanch #SarasotaCounty #SouthwestFloridaRealEstate #FloridaHousingMarket #ForeclosureMarket #RealEstateNews #HomeBuyingTips